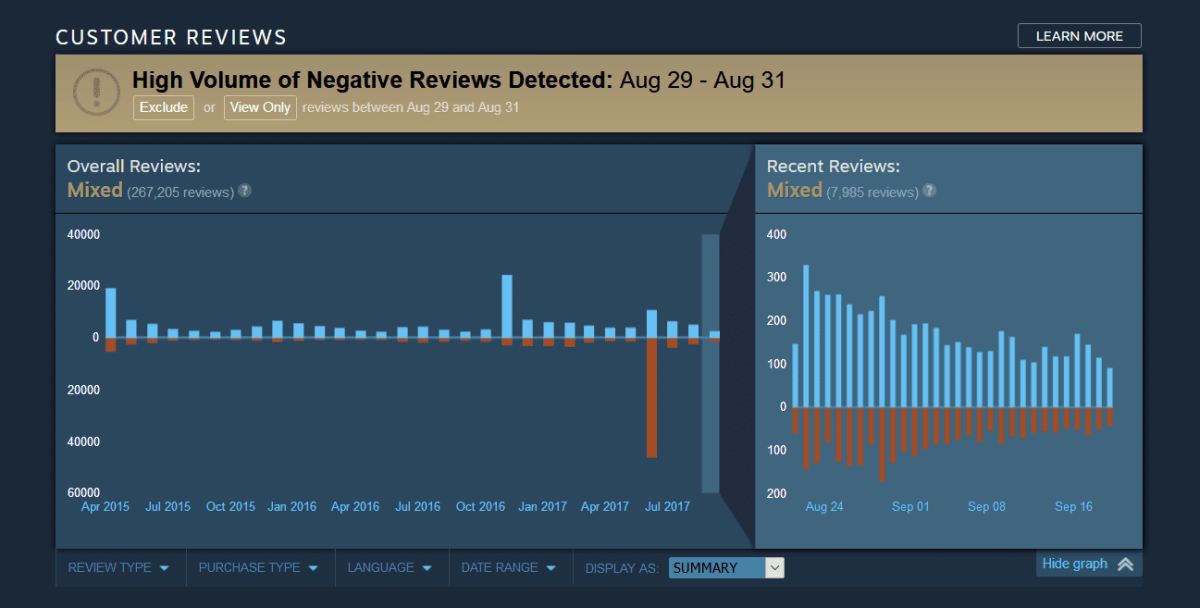
Valve have opted to address Steam review bombing (a high volume of low review scores in a short space of time, usually as an act of protest) in a very Valve way; with visual data. In fairness, they do seem have put some thought and research into this.
Their reasoning is spelled out in a new Steam post announcing the changes. It’s stated that this has been planned “for a while now”. The timeline does fit suspiciously well with Dota 2 getting review bombed after Marc Laidlaw’s reveal of the Half-Life 3 plot, but it may be best to forego the tinfoil hat.
Valve define the purpose of Steam user reviews as “tell[ing] potential purchasers whether or not they should buy the game, and why.” Valve feels that the opinions expressed in review bombs can fall under that definition, but that many of these “out-of-game” issues “aren’t very relevant when it comes to the value of the game itself.”
After looking at long-term data they found that (in general) review scores ‘corrected’ themselves over time, meaning a review bombing session resulted in a temporary distortion. Most interesting of all, “[in some cases] the developers made changes in response to the community dissatisfaction, and in others they didn’t”; but Valve found little correlation between developer action and what happened to the overall review score afterwards.
As a general conclusion on the issue though, Valve feel mass protests in user reviews make it harder for the review system to “achieve its goal of accurately representing the likelihood that you’d be happy with your purchase if you bought a game.” So they decided to figure out how to fix that problem.
They rejected a few ideas. Removing scores entirely (because people demanded scores in the first place), temporary locks on reviews during these periods (too restrictive and complicated to regulate), and changes to the way scores are calculated (potential for even more radical fluctuation in scores), were all considered.
Valve have settled on providing more information up front to potential buyers in the form of histograms. These show the volume of reviews (positive and negative) over time on every game’s review page (although not by default, you have to select to make them appear). If there was a particularly high volume during one period of time, that’s noted in a box above the graph. Here’s GTA V’s data, for example.
The period over which Take-Two and Rockstar were flirting with heavily restricting the PC modding scene is clearly visible. Valve’s reasoning is that potential players will then look at the reason behind the spike in negative reviews and decide for themselves whether this is (or was) an issue that will influence their purchase.
For games with a long lifespan, or that have spent a long time in Early Access, it gives a reasonable impression of whether the title is improving over time. Here’s DayZ’s graph, which suggests that the answer in that particular case is “not really”.
They could also be useful for indicating whether a recent update or patch has significantly improved or messed up a game. While the utility in ‘combating’ review bombing might be a bit dubious, having this additional information displayed on review pages is potentially pretty helpful.


Published: Sep 19, 2017 11:01 pm